
Back to Features
Dashboard & Visual Analytics
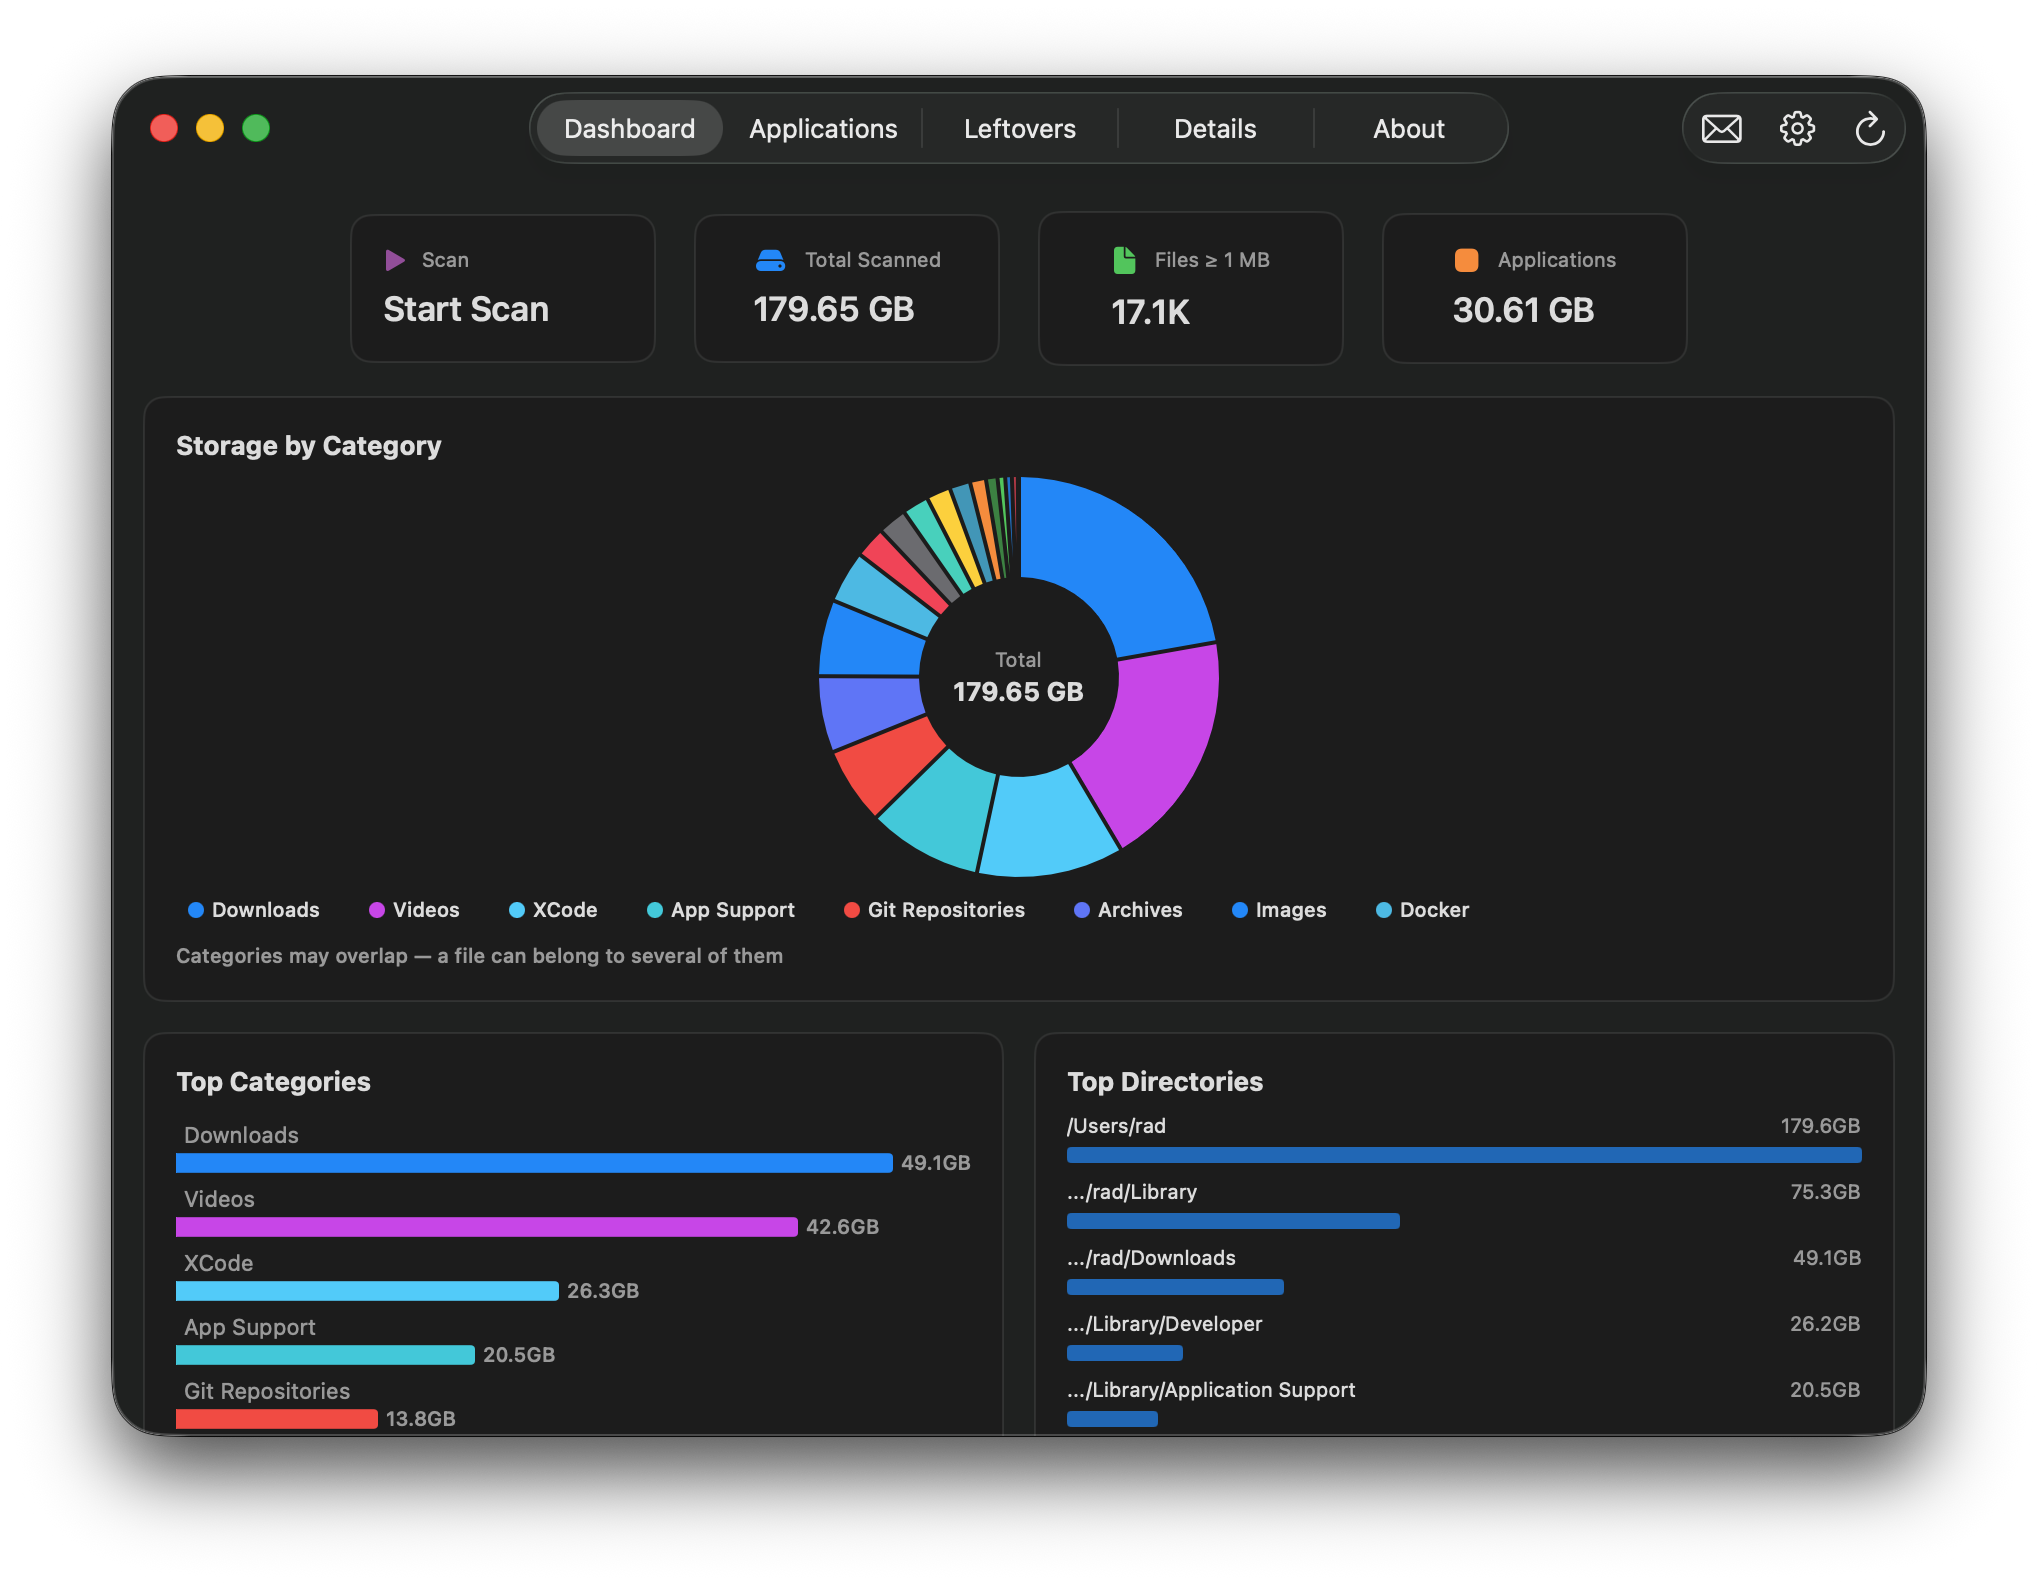
A visual overview of your disk space usage with interactive charts and statistics.
Components
Pie Chart
- Shows distribution of space across all categories
- Visual representation of where your storage is being used
Bar Charts
- Category comparison: All 26 categories displayed by size
- Directory chart: Top 10 largest directories on your disk
Quick Stats Cards
- Total scanned disk space
- Total number of files
- Total size of applications
Top Apps Widget
- Shows the 10 largest applications
- Quick overview of biggest space consumers
Interactivity
- Click on charts to navigate to detailed views
- Refresh button for real-time updates after changes
Ready to Try OverClean?
Download now and discover how much space you can reclaim.
Download & Scan Free